
What do U.S. tariffs mean for the Australian primary metals industry, and how does this impact our local Stainless steel industry?
U.S. tariffs on steel and aluminium from Australia have recently doubled from 25% to 50%, a 50% Copper tariff has been announced, and the last few months have shown that when it comes to tariffs in the U.S., anything can happen. But what does this mean for Stainless steel prices? This blog will go into detail on tariffs, possible effects on the manufacturing industry in Australia and base commodities pricing affecting Stainless steel (as of 14 July 2025).
What a tariff is, and their current volatility.
A tariff is defined as a tax or duty to be paid on a particular class of imports or exports, and their purpose is to protect domestic industries by making imported goods more expensive, encouraging consumers to purchase locally produced alternatives. These can protect local manufacturing and production operations by preventing overseas products from undercutting domestic goods’ prices by a great margin, but in the same vein, they can negatively affect businesses that sell imported goods and hurt the consumer by causing an overall increase in the cost of goods, reducing overall economic growth.
Tariffs exist in all industries and vary in their rates, depending on the goods and the relationship between nations, among other factors. In general, tariffs will be a percentage of the cost of the good. This cost is then almost always added onto the price of the good, so tariffs are shouldered by the consumer, at least in the short run before local industry can adjust by increasing economic supply.
Free Trade Agreements and other trade agreements in which tariffs are reduced or eliminated are generally negotiated among frequent trade partners (for example, CHAFTA, the China – Australia Free Trade Agreement). Australia currently has 18 FTAs in place with various nations and is working on others – the notable example being with the European Union.
The U.S. government has implemented many tariffs on goods from every foreign nation in the last few months, including Australia, some of which have been repealed or suspended or have had their rates changed, in some cases, multiple times. For businesses that import or export, this tariff volatility can result in confusion about price changes in supply chains, as well as changes in demand due to price increases. As the U.S. is the world’s largest economy, it is important to stay informed on tariff changes and how they might affect your business.
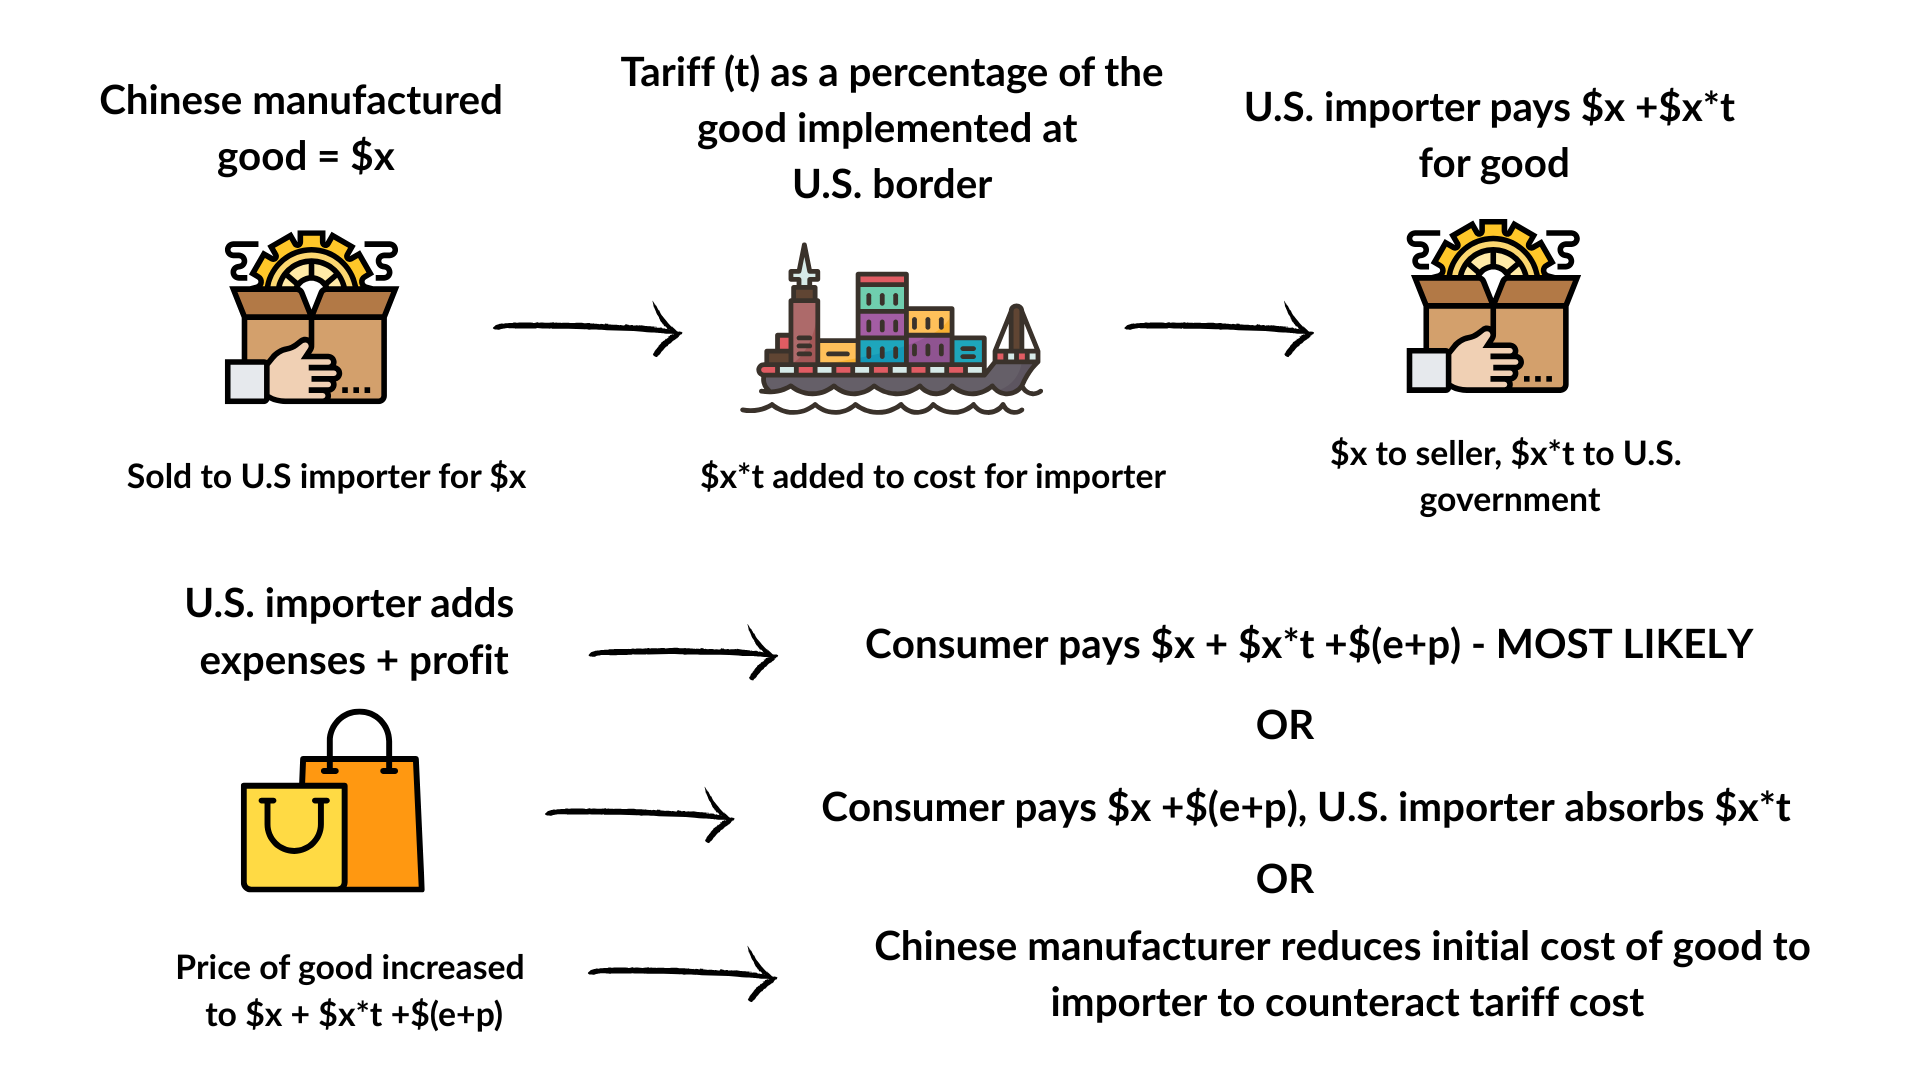
Using this graphic, we can calculate the difference in price that an increase from 25% - 50% makes for steel.
If Hot Rolled Coiled Steel is trading at US$950 per tonne, and the U.S. purchases 100 tonnes from China:
X = $95,000
With a 25% tariff: $95,000 + (0.25 * 95,000) = $118,750.00
With a 50% tariff: $95,000 + (0.5 * 95,000) = $142,500.00
This is a difference of $23,750. This must be absorbed by the consumer, importer, or manufacturer; a significant impact.
This $23,750 will either be:
Passed along to the U.S. consumer, which in this case would be any local industry that uses steel in manufacturing. This would likely lead to reduced manufacturing in the long term as increased costs become too impactful.
Absorbed by the importer. This is not sustainable in the long term for most businesses (particularly SMEs), as it can erode already thin profit margins, leading to losses.
Cut from the original price by the Chinese mill, but as with importers, this is unsustainable due to profit margin erosion.
The goal in this case is for U.S. manufacturers to purchase locally produced steel instead of imported steel by making imported steel more expensive; this is known as trade protectionism, “protecting” local industries from imported goods. However, importers are also local businesses, and tariffs like this can impact both domestic and internal economies significantly.
Changes in U.S. tariffs on Australian steel, aluminium and manufacturing industries.
As shown in the example above, the U.S. has recently increased the Australian steel and aluminium tariff from 25% to 50%, a drastic increase. Stirlings is not a supplier of Australian produced steel or aluminium products, but as these materials are very much interconnected to the same industries as Stainless (manufacturing, construction) it is important to understand any effects that these might have, as there are effects in the overall health of these industries.
Unlike with Stainless steel, Australia does have steel mills, producing ~5.7 million metric tonnes of steel annually. Australia’s iron and steel exports are worth ~US$1.5 billion per year. Iron exports, a base material for steel, Stainless steel, and other alloys, come to ~800M metric tonnes, worth ~US$130B per year.
In addition, Australia produces ~1.5 million metric tonnes of aluminium annually, worth ~US$15 billion, making Australia the world’s 6th largest producer of aluminium and the second largest producer of the intermediary product, alumina products (alumina, bauxite).
These products are exported to various countries around the world, including the U.S., but what has remained stable since 2005 is Australia’s largest trading partner and purchaser of Australian exports, China. Even when China began imposing steep tariffs on some Australian goods in 2020, it did not add tariffs to imports of Australian steel and aluminium.
In 2023, China imported 76% of Australia’s steel, iron, and aluminium. The U.S. imported 0.6%. The below graph shows what this looks like:
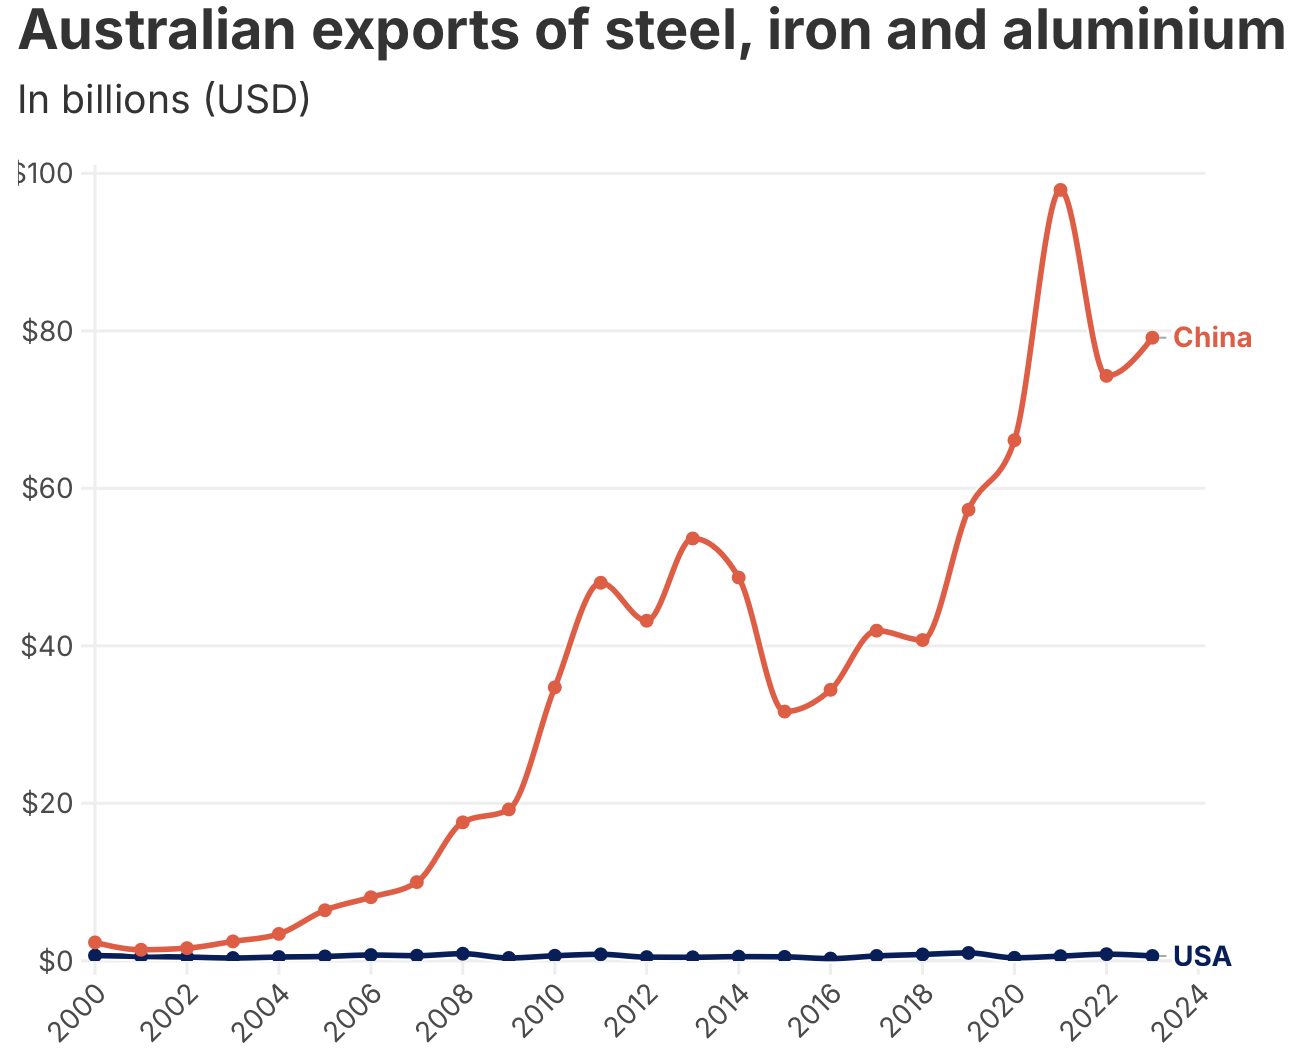
Source: USSC
The below graphs show the top 10 U.S. import volume countries of aluminium and steel from March 2024 – January 2025 (pre-tariff levels).
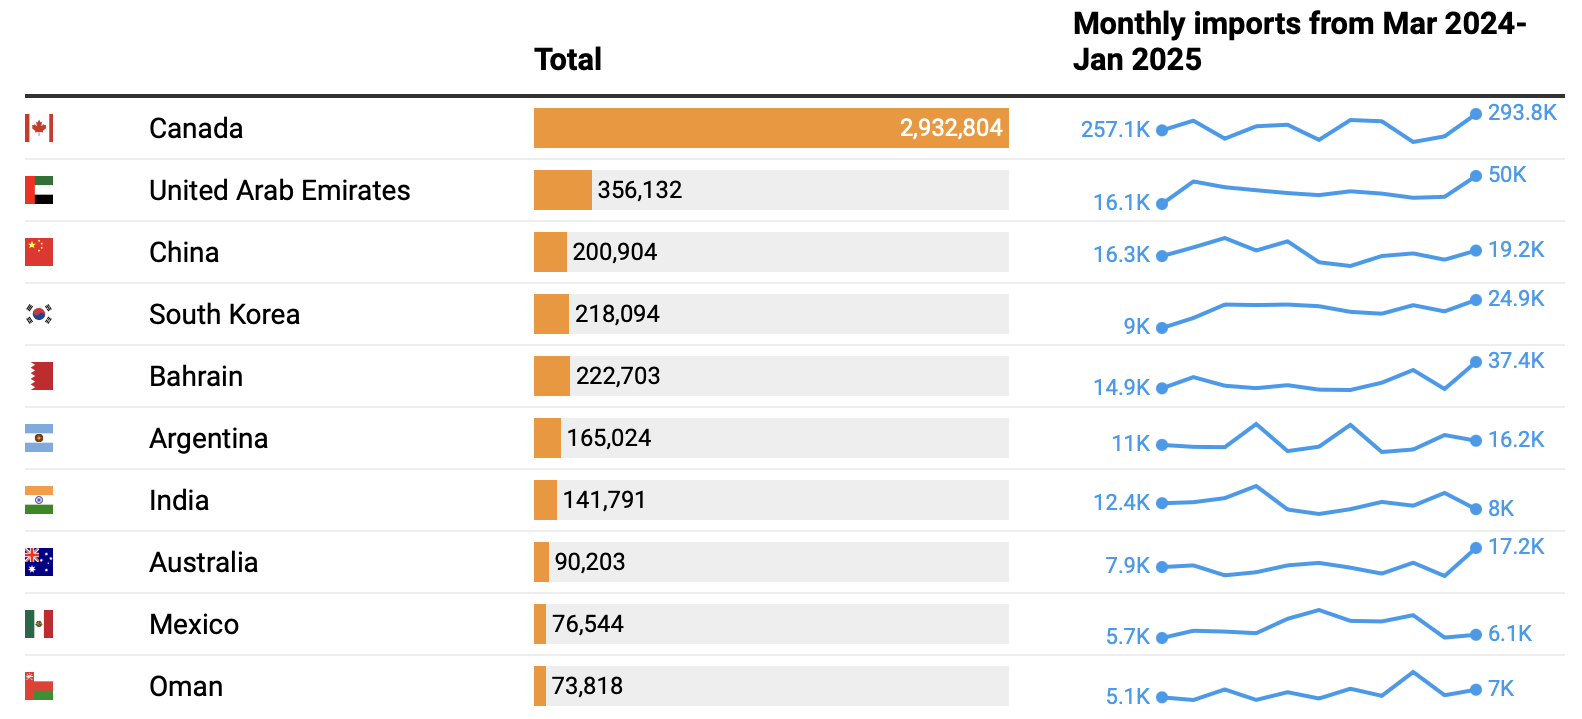
Aluminium imports to the U.S March 2024 - Jan 2025
Source: Al Jazeera
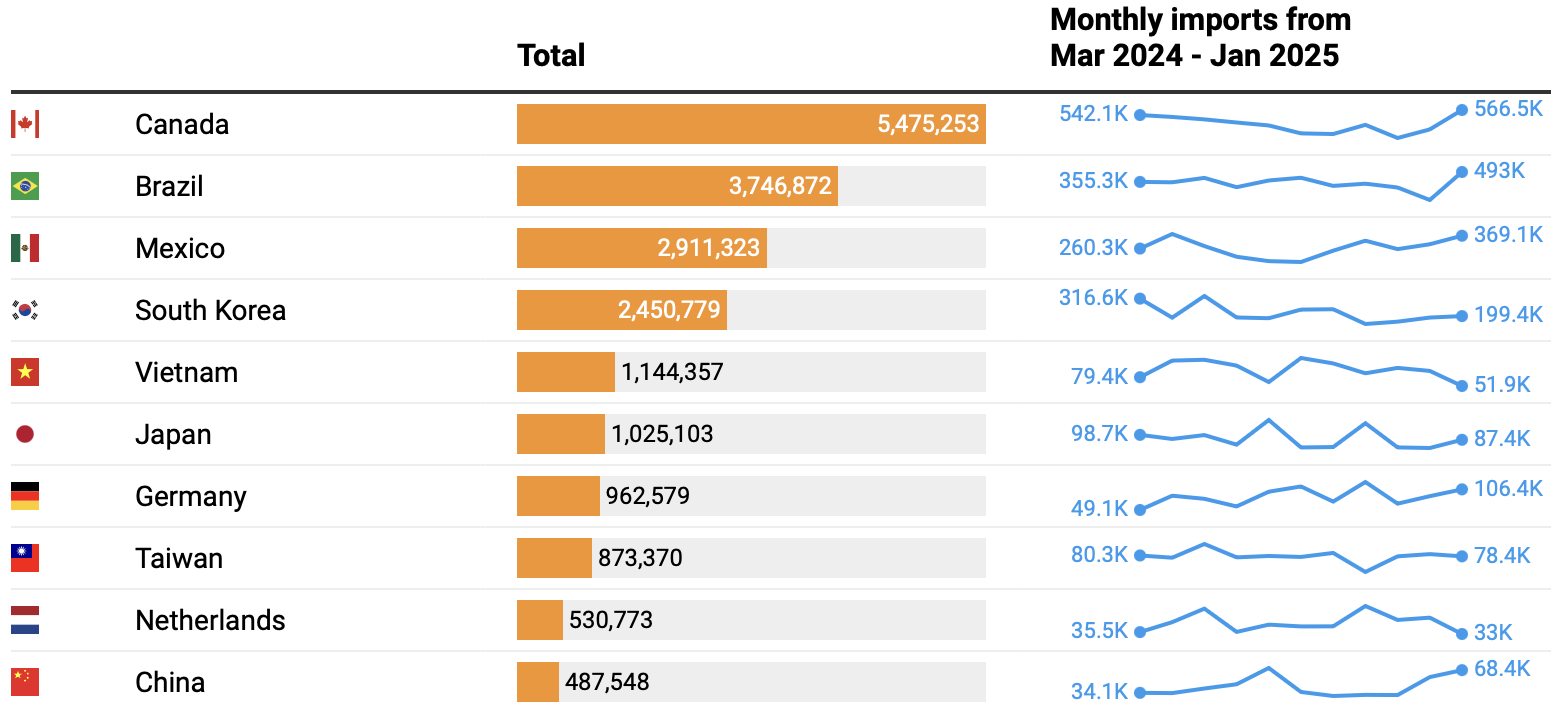
Steel imports to the U.S March 2024 - Jan 2025 (
Australia is 19th with 230,590 tonnes)
Source: Al Jazeera
As we can see, the direct effect of these elevated tariffs on Australian steel and aluminium producers will not be significant, as only about 10% of Australia’s steel and aluminium exports, and less than 1% of its overall production, go to the U.S.
Stainless steel prices in Australia
There has been no Stainless steel produced from melt in Australia since 1996, when BHP in Unanderra closed their rolling mill; thus, all Stainless steel supplied and consumed in Australia is imported. This Stainless steel comes overwhelmingly from mills in Asia and Europe. Thus, the industry in Australia is a pure import market, and prices are influenced entirely by the world economy.
One of the biggest drivers of the price of Stainless steel is the price of the base materials of Stainless alloys, including, but not limited to:
Copper;
Nickel;
And Molybdenum (particularly in higher alloyed Stainless steel).
These are affected by various factors, like every other base material, particularly supply changes from major producer countries/mills, changes in demand resulting in excess or restricted product volumes, changes in trading partner relationships/border restrictions, and major geopolitical events (such as COVID-19).
Stainless steel prices in Australia are also influenced by the foreign currency of the transaction, most commonly the U.S. Dollar but also the Euro.
These factors induce an inherent volatility to local spot prices of Stainless steel goods, and local suppliers, including Stirlings, work hard to both procure and market their inventories at the best possible prices.
Have Stainless steel material prices been affected by U.S. tariffs?
As always there are various factors that influence base material prices, and the U.S. tariffs and new international trade tensions are just one factor.
Copper
How have Copper prices been affected by tariffs?
Copper is used infrequently and in low amounts in common Stainless grades, 904L being the highest at approx. 1.5%, with lesser amounts in some Duplexes. However, in Nickel and Copper-based alloys (including 70:30 and 90:30 ‘CuNi’), it is the majority alloy by weight.
The global Copper market experienced a significant downturn in early April 2025, with prices plummeting more than 5% due to trade tensions between the U.S. and China. Various tariff and policy changes between the U.S and China throughout April and May have caused further Copper price volatility.
As of early July 2025, the U.S. announced a 50% tariff on all Copper imports, which caused prices to reach record highs at ~US$5.60 per pound. Mirroring the tariffs on steel and aluminium, this tariff is aimed at bolstering domestic production and reducing reliance on foreign supply.
This tariff has further escalated trade tensions and contributed to volatility in the metals market, with the tariff expected to come into effect at the end of July. Analysts predict more shipments into the U.S. in the short term, potentially tightening global inventories.
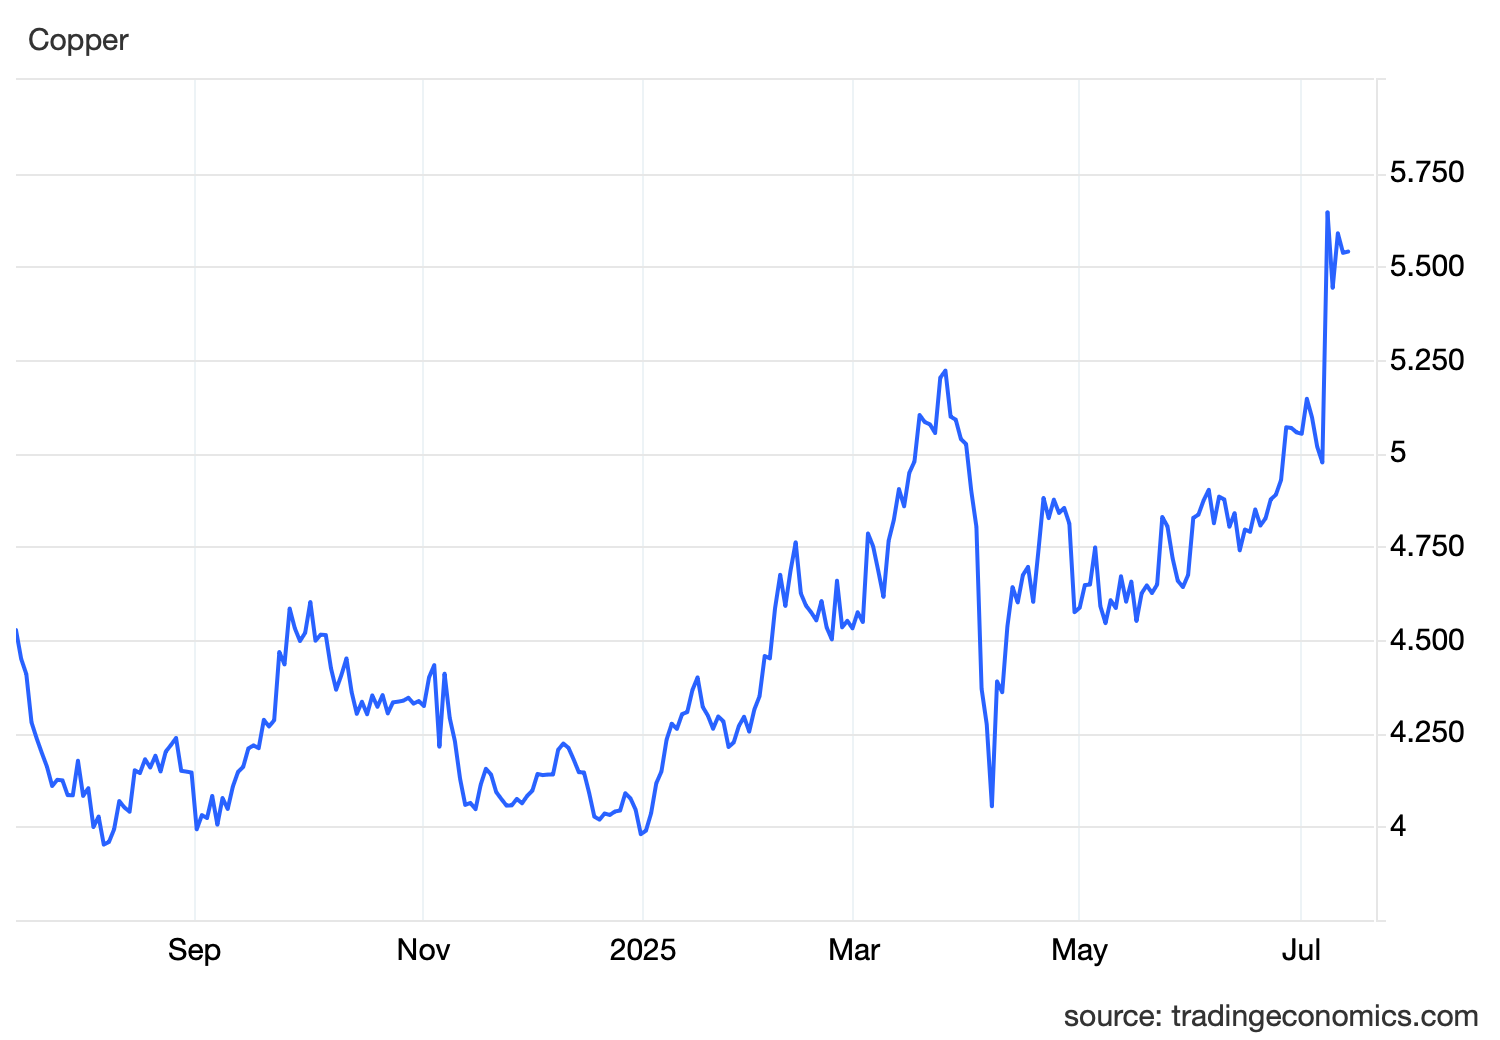
1 Year Copper Price trend (US$/pound)
Source: Trading Economics

5 Year Copper Price trend (US$/pound)
Source: Trading Economics
Demand and supply dynamics of Copper
Prior to the tariff announcement, the price of Copper was generally influenced by supply factors. Some of the more recent of these being mine disruptions in Chile and Peru and low global exchange inventories.
However, the tariff predictions and announcements abruptly shifted market focus to demand concerns - trade barriers threaten to reduce industrial activity in both the U.S. and its trading partners, leading to manufacturing and construction sectors facing increased uncertainty and widespread, global supply chain disruptions.
What's next for Copper?
Despite the current market turbulence, many analysts maintain a cautiously optimistic long-term outlook for Copper sellers, despite continued short-term price volatility. Copper’s price will be influenced by continued demand for the global energy transition which requires substantial copper for electrification (the energy transition alone is projected to increase Copper demand by 30% by 2035), and supply constraints caused by mine development timelines of 7-10 years, and ore grade deterioration at existing mines.
Nickel
How have Nickel prices been affected by tariffs?
Nickel is a vital element in Stainless steel, comprising 8-12% of most Grades; contributing to greater corrosion resistance, formability, and versatility.
Nickel prices are also determined by a multitude of factors. In the immediate aftermath of the announcement of sweeping U.S. tariffs in late March, Nickel saw a drastic price drop; however, it recovered quickly due to Indonesian supply constraints and sustained demand from Stainless steel and electric vehicle (EV) sectors. In short, whilst Nickel prices have fluctuated in response to U.S. and China’s trade tensions, the price response has not been as reactive as for Copper.
Another factor that has been affected by tariffs are trade flows: China's retaliatory tariffs on U.S. agricultural exports have shifted Nickel trade flows, with Chinese-controlled Indonesian mines prioritising domestic and non-U.S. markets. This shows how tariff policies are reshaping global supply chains. Another example is that now EV manufacturers have rerouted supply chains through South Korea to bypass restrictions.
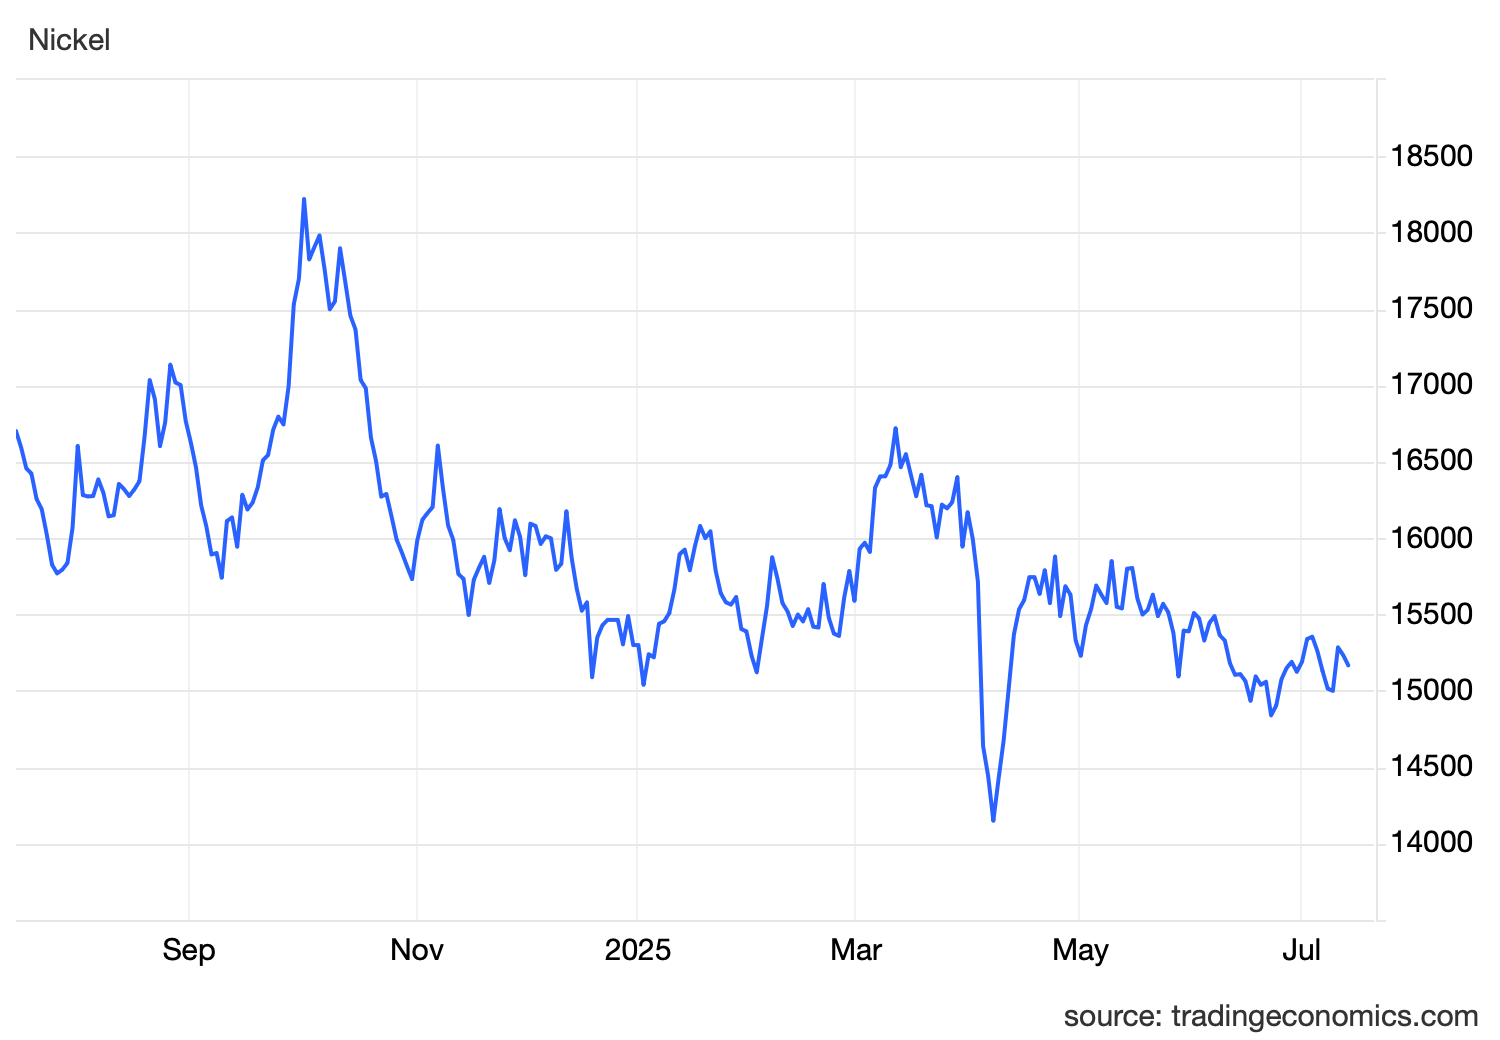
1 Year Nickel Price trend (US$/tonne)
Source: Trading Economics
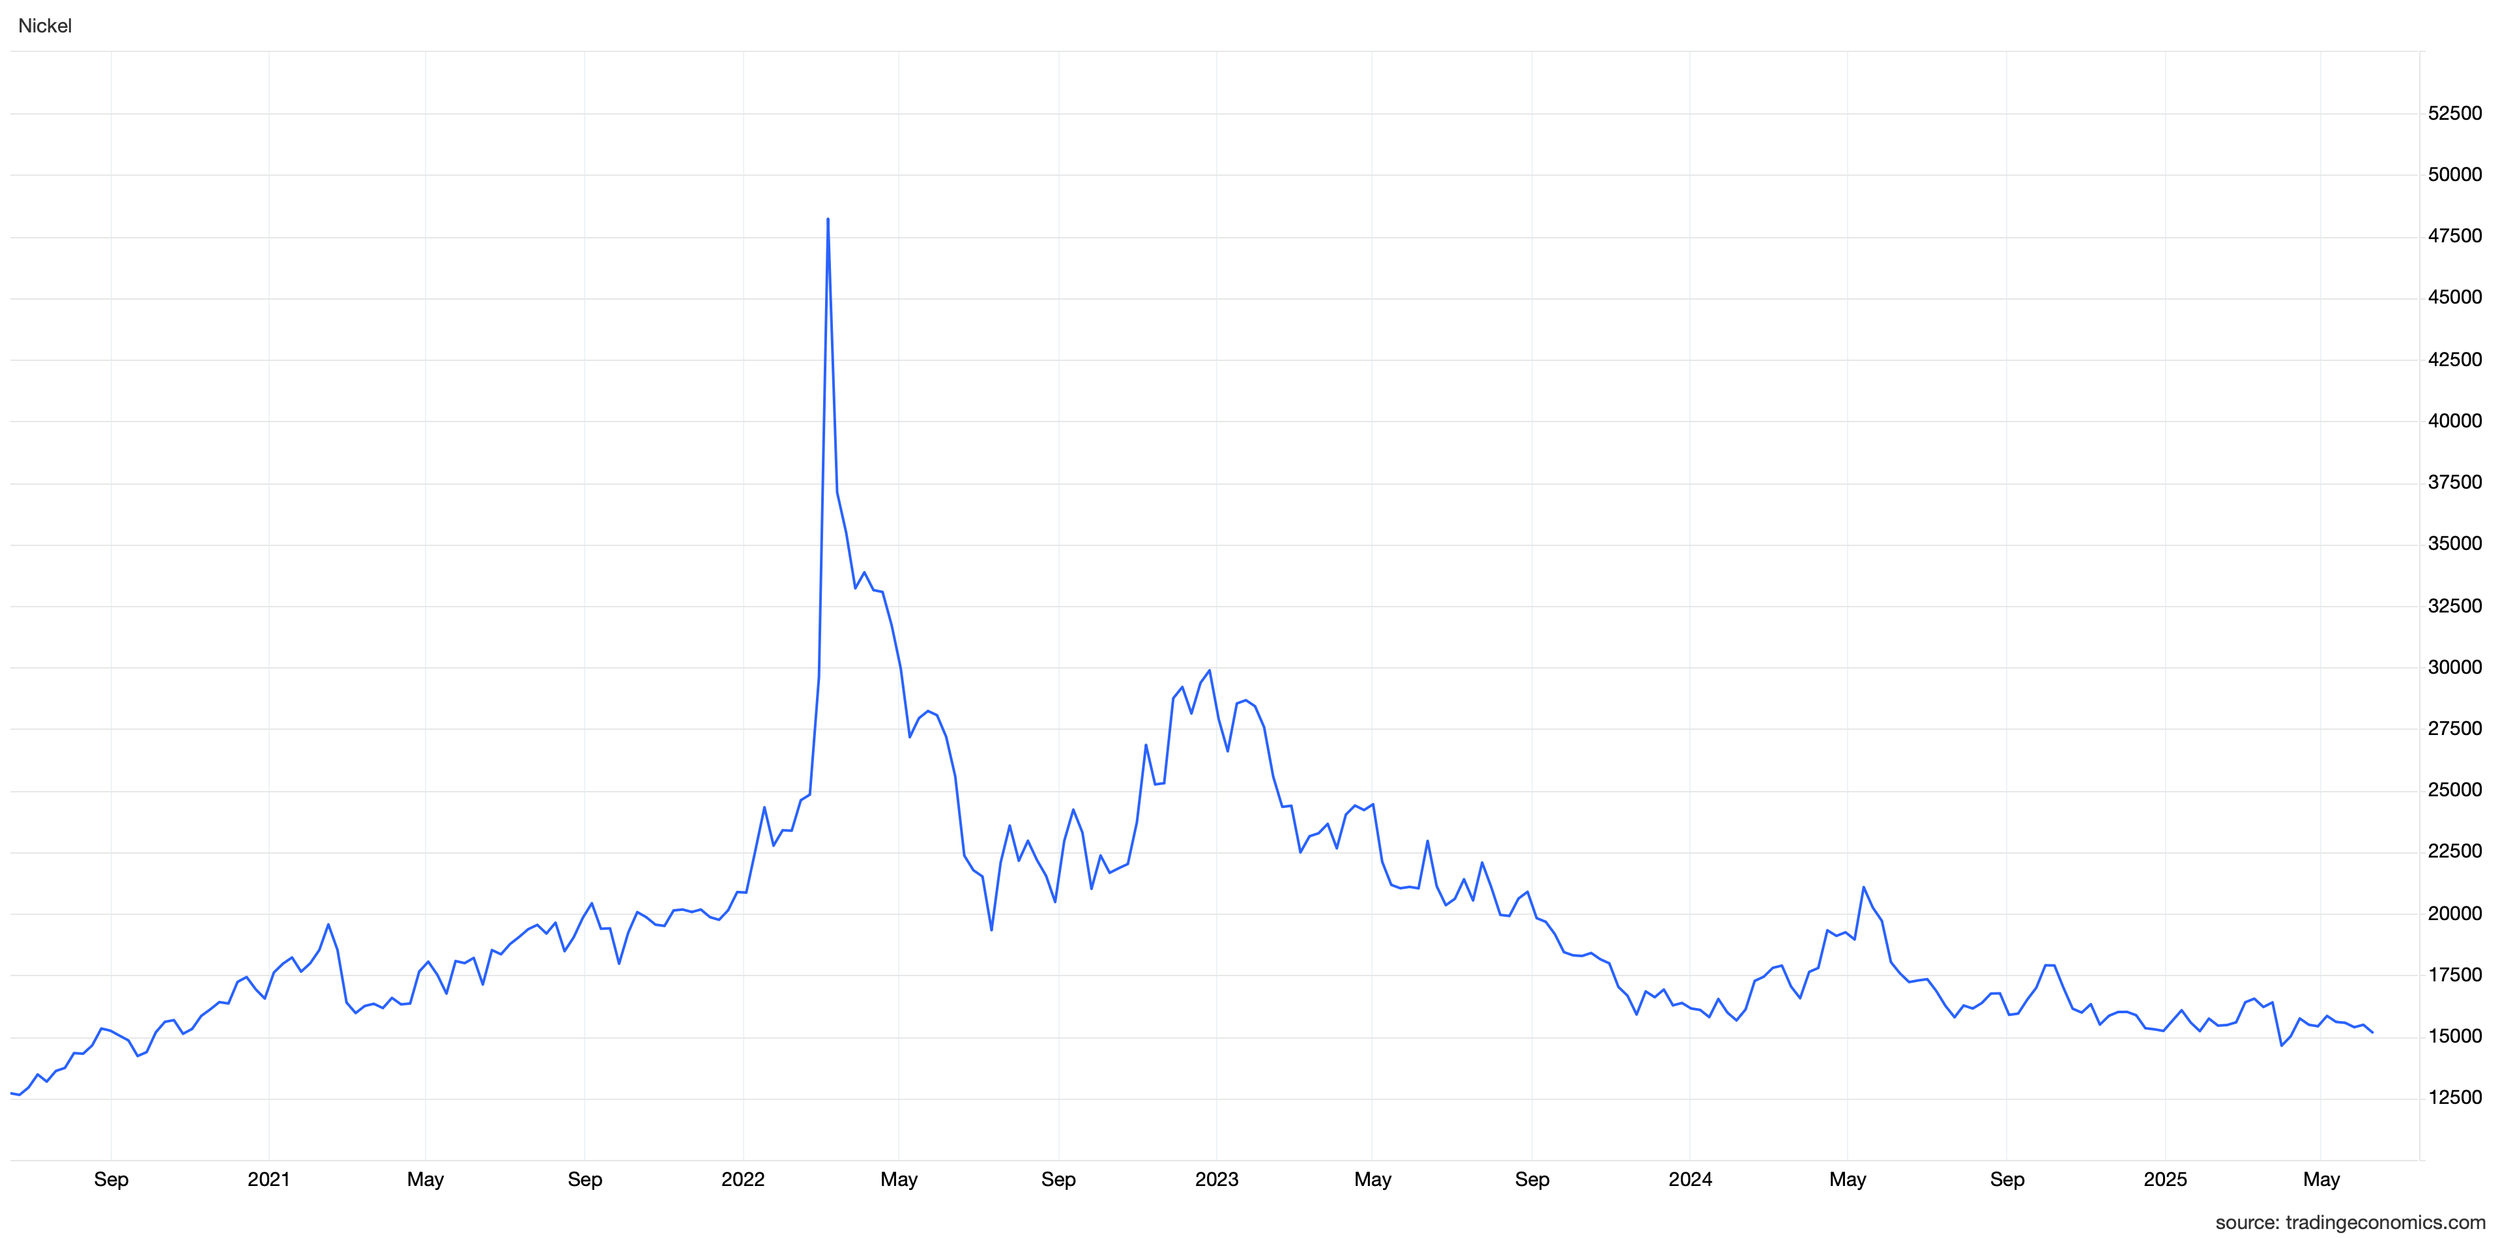
5 Year Nickel Price trend (US$/tonne)
Source: Trading Economics
Demand and supply dynamics of Nickel
Indonesia accounts for the vast majority of global Nickel output, making their supply changes a primary factor in Nickel pricing worldwide. The Philippines, Russia (subject to sanctions), New Caledonia, Canada, and Australia all roughly equally trail in production by at least a factor of 10.
In February 2025, the Philippines implemented an export ban on unprocessed nickel ore to promote domestic processing; however, this policy was not welcomed by the local industry and was removed. This, along with quota cuts on Indonesian Nickel mining has caused fluctuations in price. Seasonal factors of these countries, such as rainy seasons, also regularly cause predictable price shifts. While Indonesia produces nickel pig iron, notably for being very cheap to produce, other countries refine lateritic and sulphidic ores, which, though typically higher in purity, are more expensive to produce.
On the demand side, Chinese Stainless steel production grew by 14% YOY in Q1 2025, while EV battery demand expanded by 22%, driven by government subsidies. This demand continues to support Nickel prices despite tariff-related price volatility.
What’s next for Nickel?
Overall, Indonesian and Philippine supply changes and EV demand growth are critical drivers, potentially pushing Nickel prices higher.
However, according to world-leading Nickel market analyst Jim Lennon, as of June 2025, the Nickel market is in oversupply and this surplus is expected to continue until 2027-28. “The market is in oversupply, and in Indonesia, several projects in the pipeline will be completed soon, increasing production capacity.”
In addition, Nickel demand growth has been limited by the surge in use of cheaper lithium iron phosphate batteries. Lennon has reduced his estimate for the battery sector’s Nickel demand in 2030 to 967,000 tonnes, a significant decrease from the industry consensus forecast of 1.5 million tonnes two years ago.
Molybdenum
How have Molybdenum prices been affected by tariffs?
Molybdenum is a less abundant rare-earth mineral primarily used to make corrosion-resistant alloys and other products for key critical sectors. In Stainless steel, it is key in enhancing corrosion resistance, especially in chloride-containing and acidic environments. It also increases strength, hardness, and resistance to high temperatures.
Molybdenum’s price drop in April 2025 came as a result of China’s retaliatory tariffs to the U.S., for which China has moved to block the U.S. and its allies from accessing essential critical minerals, including Molybdenum, with analysts inferring that the restrictions are targeting the U.S. defence industry. As the dominant supplier worldwide, China can leverage its Molybdenum stronghold in the trade standoff.
In June 2025, the U.S. and China came to a new agreement, with China standing down on export controls of critical minerals necessary to key U.S. industries, resulting resulted in a price rebound. It then dipped to below 440 CNY/kg (~US$61/kg), before increasing to 510 CNY/kg (~US$71/kg) shortly after.
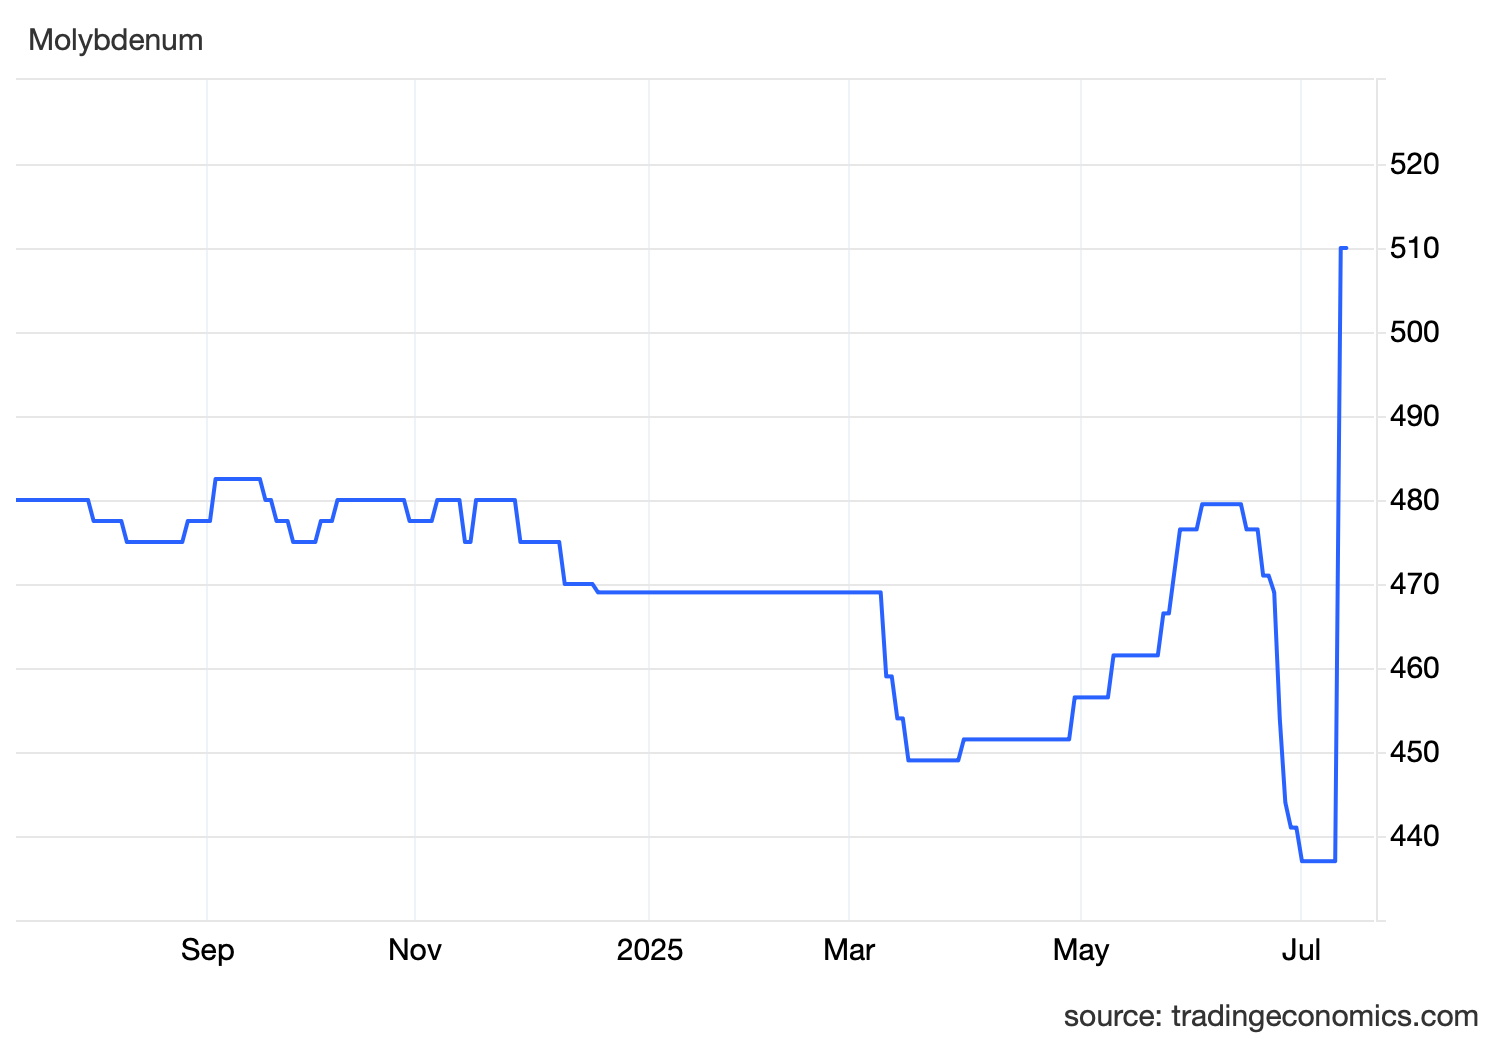
1 Year Molybdenum Price trend (CNY/kg)
Source: Trading Economics
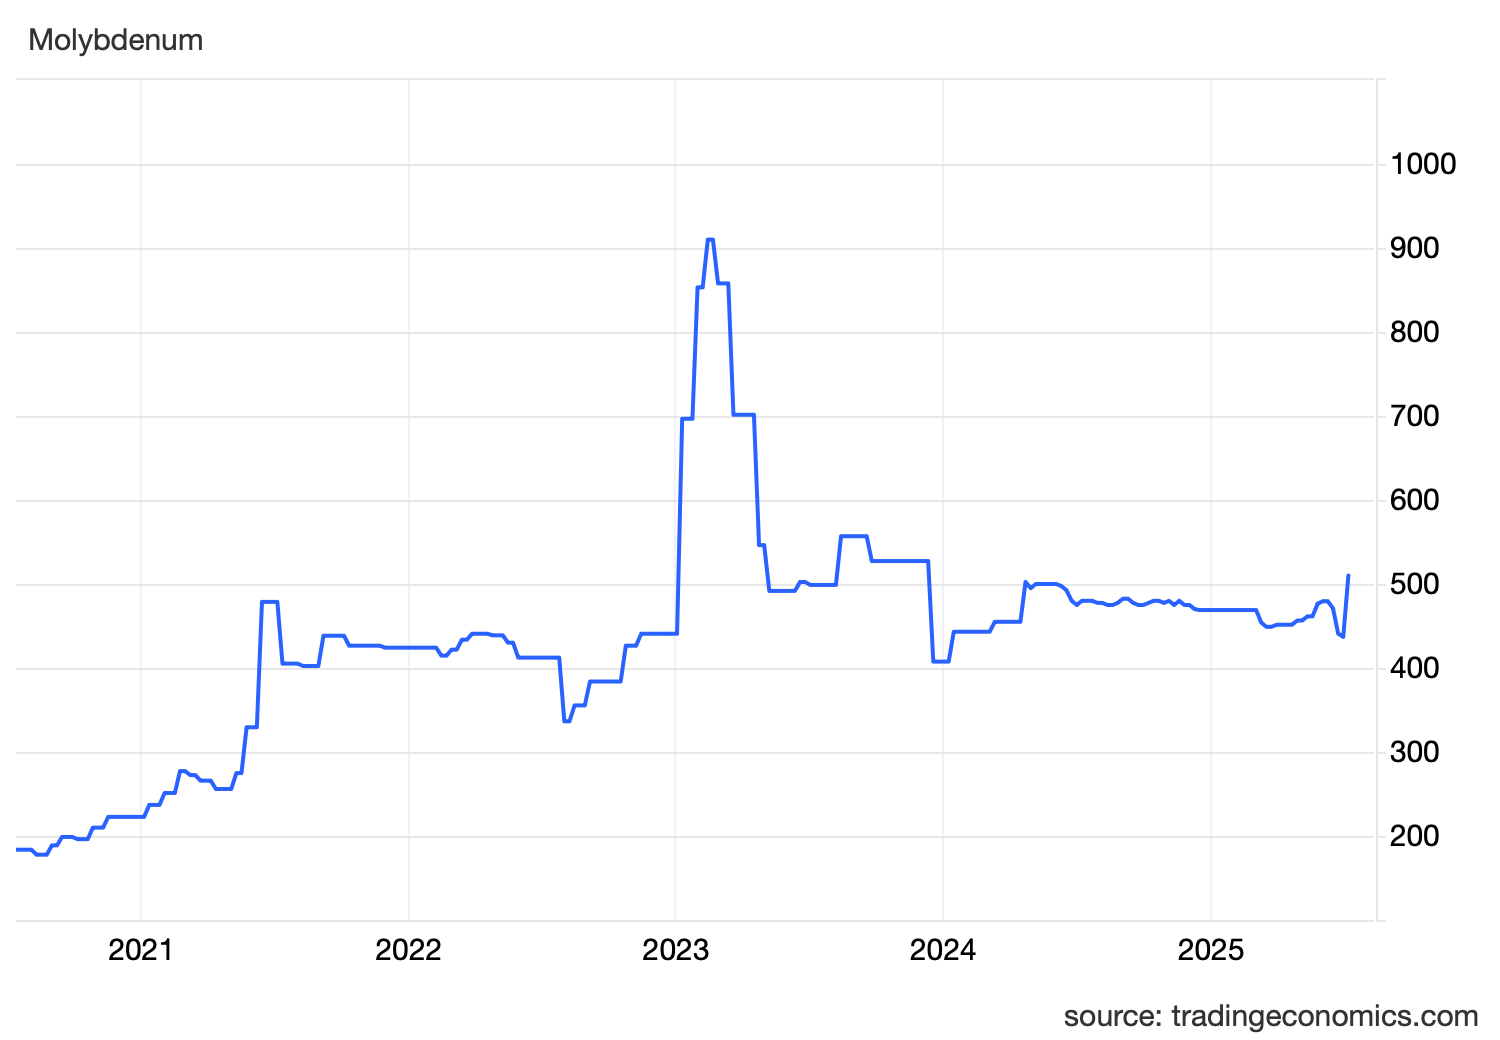
5 Year Molybdenum Price trend (CNY/kg)
Source: Trading Economics
Demand and supply dynamics of Molybdenum
China is the dominant producer of Molybdenum, accounting for an estimated 110,000 metric tons (MT) in 2024 (45% of global production), followed by Peru (41,000 MT) and Chile (38,000 MT). A 6% YOY increase in global production demonstrates its importance in high-performance alloys, energy infrastructure, and industrial applications.
Over 75% of global consumption of Molybdenum is tied to highly corrosion resistant steel/Stainless steel/Performance Alloy production. On the green transition side, it holds a vital role in wind turbine shafts and solar panel supports, while defence industries rely on Molybdenum for armour plating and missile systems.
What’s next for Molybdenum
The demand for Molybdenum is not due to slow down due to its critical importance in the green and defence industries. Trade tensions between major economies can significantly impact Molybdenum availability; therefore supply chain diversification has become a strategic priority for industries dependent on the element. Regional processing hubs are emerging in countries with stable political environments to prevent supply disruptions.
Analysts predict that annual global production is projected to reach 350,000 MT by 2030, driven by energy transition needs. Recycling initiatives, recovering 40% of scrap Molybdenum, will complement primary supply. Supply chain resilience requires diversification beyond China, and policymakers must balance environmental concerns with industrial demands to ensure long-term sustainability of global Molybdenum production.
Uncertainty and future planning
Regarding steel and aluminium manufacturing, perhaps the most significant impact of the ongoing changes to U.S. tariff policy is uncertainty. Trade policy uncertainty reduces international trade flows and reduces business investment, as not knowing what the policy will be tomorrow, let alone five years from now, will make any company hesitant to commit major funds. This has, and will, have ripple effects on several industries that utilise Stainless steel. It is important to note that we have seen significant market disruptions in the last few years with the war in Ukraine, COVID, and other geopolitical disruptions, and in response, commodities prices have fluctuated and stabilised.
In regard to Stainless steel in particular, as we can see, despite a strong reaction after the initial tariff announcements, existing demand and supply factors and the slight reduction of trade tensions since March have brought Copper, Nickel and Molybdenum prices back or close to pre-tariff levels, meaning that Stainless steel is not likely a material that is going to be significantly affected in the long term.
The team at Stirlings is always observing and responding to any global changes, and we, as always, ensure our customers receive excellent service and value. You'll never be uncertain with us as your Stainless supplier.
Sources: